

Long Island Housing Market Update – September 2026: Prices Keep Rising, but Buyers Are Seeing Different Markets

Long Island Housing Market Update – September 2026: Prices Keep Rising, but Buyers Are Seeing Different Markets
September brought a familiar headline to Long Island real estate: home prices are still higher than they were a year ago.
But look a little closer, and the story becomes much more interesting.
Across Suffolk County, Nassau County, and Queens, median sales prices increased compared with September 2025. Yet the number of homes sold, the amount of available inventory, and the time properties spent on the market tell three somewhat different stories.
Suffolk saw more closed sales and continued competition for single-family homes. Nassau recorded higher prices despite fewer completed transactions. Queens also experienced price growth, but buyers generally had more inventory to choose from and properties took longer to sell.
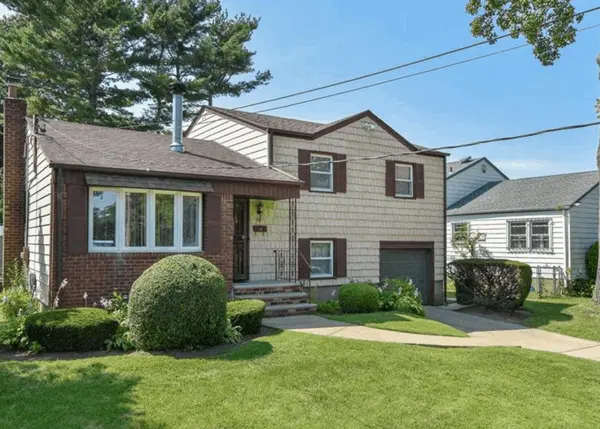
This is why I always encourage buyers and sellers to look beyond a single headline or countywide median price. The market for a well-maintained ranch in western Suffolk may behave very differently from the market for a co-op in Queens or a higher-priced property in Nassau.
Let's examine what September's numbers are telling us and, more importantly, what they could mean for your next move.
September 2026: The Long Island Market at a Glance
According to OneKey MLS, the median sales price increased year over year in all three counties. Inventory remained relatively limited in Suffolk and Nassau, while Queens continued to offer a broader selection of properties relative to its sales pace.
| Market Indicator | Suffolk | Nassau | Queens |
|---|---|---|---|
| Median Sales Price | $725,000 | $830,000 | $650,000 |
| Annual Price Change | +3.6% | +2.5% | +3.2% |
| Closed Sales | 1,207 | 895 | 571 |
| Annual Sales Change | +4.2% | -4.8% | +1.8% |
| Homes for Sale | 3,668 | 2,719 | 3,890 |
| Months of Supply | 3.4 | 3.3 | 6.7 |
| Days on Market | 41 | 43 | 77 |
Source: OneKey MLS September 2026 Monthly Indicators. Data as of October 7, 2026. Figures include single-family homes, condominiums, and co-ops. Annual changes compare September 2026 with September 2025. Days on market measures the average time from listing until an offer is accepted.
What immediately stands out is that prices rose everywhere, even though sales activity moved in different directions.
That tells us buyers haven't disappeared. But affordability, inventory, and property-specific value are influencing how buyers respond.
Suffolk County: More Homes Sold, but Inventory Remains Tight
Suffolk County entered the fall market with continued demand and relatively limited inventory.
The median sales price across all residential property types reached $725,000, an increase of 3.6% from September 2025. Closed sales rose 4.2% to 1,207 transactions, while active inventory declined 3.8% to 3,668 homes.
That's notable because sales increased even though buyers had fewer properties available than a year earlier.
Single-Family Homes Continue to Lead
Looking specifically at single-family homes, Suffolk's median sales price reached $740,000, up 2.8% year over year.
There were 1,041 closed single-family sales, an increase of 4.6%. Homes spent an average of 40 days on the market before an offer was accepted, compared with 44 days one year earlier.
Perhaps the most revealing number is the percentage of original asking price received: 101.0%.
On average, single-family homes that closed in September sold slightly above their original listing prices. That doesn't mean every property received multiple offers or sold above asking. It does, however, indicate that competitive pricing and buyer demand continued to support sellers in many parts of Suffolk.
The county had just 3.4 months of single-family inventory, down from 3.6 months a year earlier.
The Suffolk takeaway: Buyers may be more selective about condition and value, but well-positioned single-family homes are still competing in a market with relatively limited supply.
There's another side to the Suffolk story: affordability.
The single-family housing affordability index stood at 73, down from 79 in September 2025. This index compares income with the amount needed to qualify for a median-priced home under prevailing financing conditions. A lower number indicates reduced affordability.
For buyers, that reinforces the importance of looking beyond the purchase price and understanding the full monthly cost of ownership, including property taxes, insurance, and maintenance.
Nassau County: Prices Rise Even as Closed Sales Decline
Nassau County presented a different picture in September.
The median sales price across all property types increased 2.5% to $830,000. However, closed sales declined 4.8% to 895 transactions.
At the same time, active inventory fell 3.2% to 2,719 homes, leaving approximately 3.3 months of supply.
It's tempting to look at fewer closed sales and assume the market is weakening. But that conclusion would be too simplistic.
Fewer transactions can reflect several factors, including limited inventory, affordability constraints, the timing of contracts and closings, and changes in the mix of homes being sold.
The fact that prices continued increasing while inventory remained constrained suggests sellers still held meaningful advantages in portions of the Nassau market.
However, those advantages aren't unlimited.
Across all property types, sellers received an average of 99.5% of their original asking prices. That's an improvement from 98.9% a year earlier, but it also shows why sellers should be careful about assuming every home will sell above its asking price.
Nassau's average days on market declined from 46 to 43, indicating that properties reaching an accepted offer generally did so a little faster than one year earlier.
The practical lesson is that pricing and presentation still matter. Buyers are willing to act when a property meets their needs and represents reasonable value, but an ambitious asking price alone doesn't guarantee a strong result.
Queens: More Inventory Creates a Different Negotiating Environment
Queens continues to demonstrate why regional housing-market headlines need context.
The borough's median sales price increased 3.2% year over year to $650,000. Closed sales rose 1.8% to 571 transactions.
Yet Queens had approximately 6.7 months of inventory, compared with 3.4 months in Suffolk and 3.3 months in Nassau.
That difference is significant.
Months of supply estimates how long the current inventory would last at the recent pace of pending sales. Generally speaking, more months of supply means buyers have a broader selection relative to demand.
Queens properties also spent an average of 77 days on the market before an offer was accepted, up from 71 days a year earlier.
And sellers received an average of 96.0% of their original asking prices, compared with 96.7% in September 2025.
These figures suggest buyers may have more room to evaluate options and negotiate than they do in many parts of Suffolk or Nassau.
But Queens is far from one uniform housing market.
Single-family homes had a median sales price of $925,000 in September, up 2.8% year over year. Condominiums had a median of $620,800, while co-ops had a median of $335,000.
Those are very different property categories, with different financing considerations, ownership structures, monthly expenses, and buyer expectations.
For anyone comparing Queens with Nassau or western Suffolk, the type of home matters just as much as the countywide median.
Is Long Island Still a Seller's Market?
In many segments, yes. But the answer depends on where you're looking and what type of property you're discussing.
Suffolk and Nassau both reported just over three months of inventory. That generally indicates relatively constrained supply and conditions that can favor sellers.
Queens, at 6.7 months of supply across all property types, reflects a more balanced or buyer-favorable environment by comparison.
But even within a seller-favorable county, not every home enjoys the same level of demand.
A move-in-ready property priced competitively against recent comparable sales may attract significant attention. Another property with a higher asking price, substantial updating needs, or unusual features may require more time and negotiation.
The important distinction is that a seller's market does not mean sellers can ignore what buyers are telling them.
Buyers still compare properties. They still evaluate condition. And with affordability under pressure, the total cost of purchasing a home matters more than ever.
What September's Numbers Mean for Long Island Buyers
If you're planning to purchase a home this fall, the most important thing is understanding the market you're entering rather than assuming conditions are the same everywhere.
In competitive single-family segments of Suffolk, buyers should be financially prepared, understand recent comparable sales, and know their comfortable payment range before making an offer.
That doesn't mean waiving important protections or offering more than you can afford. It means being ready to make a thoughtful decision when the right property becomes available.
In Nassau, where prices remain elevated and supply is limited, buyers may need to compare the trade-offs between location, condition, property taxes, and renovation costs.
In Queens, the longer average marketing time and higher months of supply may provide opportunities for more detailed evaluation and negotiation, depending on the property.
One thing I would caution against is waiting for a dramatic market-wide price decline without considering what that means for your own situation.
Prices increased year over year in all three counties in September. That doesn't tell us what prices will do next, but it does remind us that a slower pace of activity isn't necessarily the same thing as falling prices.
If you're evaluating your budget, read our guide to understanding closing costs on Long Island so you can plan for expenses beyond the down payment.
What Long Island Sellers Should Take Away
For sellers, September's numbers are encouraging, but they shouldn't be interpreted as permission to overprice.
Low inventory can help a well-positioned property stand out. However, buyers are increasingly conscious of monthly expenses, property condition, and the cost of improvements after closing.
That's why the initial asking price remains so important.
A strong pricing strategy should consider recently closed comparable sales, current competing listings, pending activity, and the property's specific features and condition.
It should also account for the fact that today's competition may look different from what was available a month ago.
For homeowners considering selling before the end of the year, there may be opportunities as some competing properties leave the market or other sellers delay listing until spring.
But the advantage comes from preparation and positioning, not simply from putting a property on the market.
If you're uncertain whether to invest in updates before listing, our article Should You Renovate Before Selling Your Long Island Home—or Sell It As-Is? explores how to think through that decision.
What I'm Watching as We Move Deeper Into Fall
There are several developments worth following as the year winds down.
The first is inventory. September showed year-over-year declines in the number of available homes across Suffolk, Nassau, and Queens. If inventory continues tightening seasonally, buyers may face fewer choices even as overall activity slows.
The second is pending sales. Suffolk's pending transactions declined 1.7% year over year, while Nassau increased 1.8% and Queens rose 6.9%. Pending sales can provide an early indication of future closing activity, although not every pending transaction ultimately closes.
The third is affordability. Housing affordability indexes declined year over year in all three counties, reminding us that purchasing power remains an important constraint on demand.
Finally, I'll be watching the relationship between asking prices and actual sale prices.
That's where we can begin to see whether sellers are adjusting their expectations and how much negotiating leverage buyers have in different segments.
One month doesn't establish a lasting trend. But taken together, these indicators can help us understand whether market conditions are becoming more competitive, more balanced, or more favorable to buyers.
The Bottom Line: There's No Single Long Island Housing Market
September 2026 reinforced something I believe every buyer and seller should understand.
Long Island real estate is local.
Suffolk experienced stronger closed-sales activity and continued competition for single-family homes. Nassau saw rising prices despite fewer closings. Queens offered a different balance between inventory, marketing time, and negotiation.
All three counties experienced year-over-year price growth, but that doesn't mean every property increased in value by the same percentage.
Countywide statistics provide useful perspective. Your actual buying or selling decision should be based on the homes you're competing against, the recent transactions most comparable to your property, and your personal financial and timing goals.
That's how you turn market information into a practical real estate strategy.
What Does Today's Market Mean for Your Next Move?
Whether you're preparing to sell, searching for your next home, or simply wondering what your property may be worth, a countywide median price is only the starting point.
Let's look at what's happening in your specific market, review the competition, and develop a plan that fits your goals.
Let's Get You Moved.
Data source: OneKey MLS September 2026 Monthly Indicators for Suffolk County, Nassau County, and Queens County, reported as of October 7, 2026. Statistics reflect MLS-reported residential activity and may be revised. Median sales prices describe properties sold during the reporting period and do not measure the appreciation of individual homes. Market conditions vary by community, property type, price range, and condition.
Categories
- All Blogs (170)
- Baby Boomers (5)
- Beaches (8)
- Buyer Education (37)
- Central Suffolk Living (2)
- Communities (18)
- Demographics (1)
- Distressed Properties (1)
- Down Payments (4)
- Featured (5)
- First Time Home Buyers (20)
- For Buyers (42)
- For Sellers (34)
- Foreclosures (1)
- Generation X (4)
- Golf (1)
- Holidays (3)
- Holidays on Long Island (1)
- Home Buying Tips (13)
- Home Financing (1)
- Home Improvement (1)
- Home Preparation (2)
- Home Selling Tips (11)
- Home Styles (2)
- Homeownership (3)
- Housing Market Updates (17)
- Housing Trends (1)
- Infographic (4)
- Interest Rates (5)
- Lifestyle (41)
- Local Attractions (24)
- Long Island Housing Market (6)
- Long Island Living (44)
- Long Island Real Estate (46)
- Market Insights (29)
- Move-Up Buyers (19)
- Neighborhood Guide (2)
- New Construction (2)
- North Shore Living (1)
- Outdoor & Recreation (4)
- Pricing (13)
- Real Estate Process (2)
- Relocation Guide (36)
- Rent vs. Buy (6)
- Seasonal Real Estate (1)
- Seller Education (25)
- Selling Myths (9)
- Senior Market (3)
- South Shore Living (5)
- Suffolk County Real Estate (3)
- Things to Do (21)
- Western Suffolk Living (5)
- Western Suffolk Neighborhoods (2)
Recent Posts





R.E. Associate Broker License ID: 10301221652
+1(631) 257-1522 | kenville@listingsoflongisland.com